Visual Studio Profiler – Setup issues & Solution
Few days back i faced a performance issue with one of Web application’s screen. It was taking around 2 minutes to load. As I am part of a bigger team and many developers worked on that module. It was really hard and time-consuming for me to dig down each line of code and figure out the bottle necks of the page. I searched on the google and found a way to profile web application using Visual studio.
There are many other tools to do this job but most of them don’t work and others are not free. I always look for the FREE stuff.
Initial Setup:
1) Click on “Analyze > Launch Performance Wizard.
2) Select the targets you like to profile. As I was profiling ASP.net website, I selected “Profile an ASP.NET application”
3) It will ask you for the URL. Don’t give the application physical path here. Write the local URL of the application.
e.g. http://[computer-name]/ASPApp
4) Profiling Method : You can choose either of two profile methods ( Sampling OR Instrumentation ). It depends upon your requirement. I selected “Instrumentation”.
You can find the initial setup for Visual Studio profiler in more detail here : http://msdn.microsoft.com/en-us/library/ms182372.aspx
2nd Step:
After you done with the initial setup, It will open a “Performance Explorer” on the left side of VS. It will list down all the dlls your ASP.net Webapplication is using.
As I only need to profile a specific module, I deselect all the Dlls except few. If you don’t want to profile the whole application then de-selecting all other DLLs will save a lot of time.
3rd Step:
When I clicked “Launch with Profiling”, it gave me the error :
“Launch Error: The web site could not be configured correctly; getting
ASP.NET process information failed. Requesting
‘http://localhost:[Port]/[AppName]/VSEnterpriseHelper.axd’ returned an error:
Unable to connect to the remote server”
Do the following Steps:
1) VS profiler updates the existing web.config with few new settings and takes the backup of the old web.config. As user “Start” the profiler, VS writes in web.config and as user “Stop” the profiler. VS replaces the new web.config file with the one in backup. So make sure that your web.config has “Write” permission.
2) Add the following line in “httpHandlers” section of web.config:
<add verb=”GET” path=”VSEnterpriseHelper.axd” type=”Microsoft.VisualStudio.Enterprise.Common.AspNetHelperHandler, Microsoft.VisualStudio.Enterprise.ASPNetHelper, Version=9.0.0.0, Culture=neutral, PublicKeyToken=b03f5f7f11d50a3a” />
3) If you have already a “Location” tag in your web.config then modify that tag to :
<location path=”VSEnterpriseHelper.axd”>
If you don’t have “Location” tag in your web.config. VS profiler will add that when it will start running.
4) Windows Event viewer is the Key. If you recieve any error. Look into the Event viewer and it will give you the details of the error. As VS Profiler errors is not that much descriptive.
Running the Profiler:
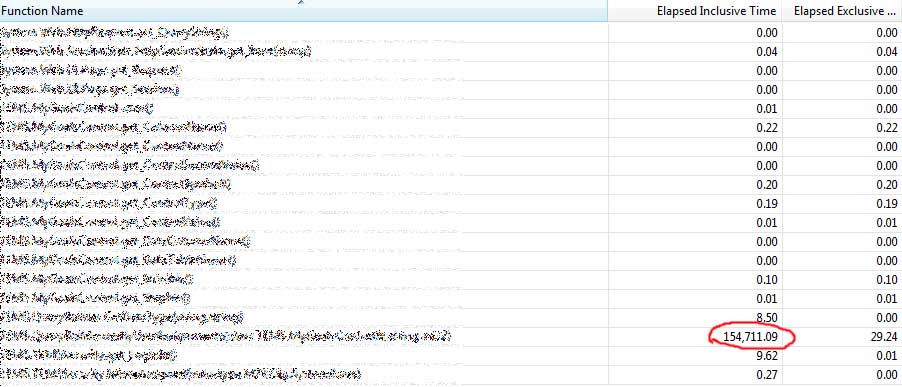
Now I am able to run the profiler and I can clearly see which procedure is taking most of the processing time:


